HELP SECTION
Following section explains the API for the query of database, interpretation of results and FAQ's.
REST API
A Representational State Transfer (REST) design architecture has been used to design API(Application Programing Interface) for PLIC database. All the tables in the PLIC database can be queried to get the results in json format. Please refer to Enhanced Entity Relationship diagram (EER) to understand the different tables present in the PLIC database and query accordingly. Following examples highlights different types of queries that can be performed:
For example to get all the details about binding_site_ID = 1, type the following command on your terminal:
GET http://proline.biochem.iisc.ernet.in/PLIC/restfulget/query_table/binding_site_ID/1
On MAC OS, equivalent of this would be:
curl -v -X GET http://proline.biochem.iisc.ernet.in/PLIC/restfulget/query_table/binding_site_ID/1
The above query would result in the display of the following output in JSON format:
{
     "0":
     {
         "binding_site_ID": "1",
         "binding_site_NAME": "101m_HEM_A_155",
         "PDBID": "101M",
         "CHAINID": "A",
         "LIGID": "HEM",
         "ligNAME": "PROTOPORPHYRIN IX CONTAINING FE",
         "pdbTITLE": "SPERM WHALE MYOGLOBIN F46V N-BUTYL ISOCYANIDE AT PH 9.0",
         "pdbRES": "2.07",
         "proteinNAME": "MYOGLOBIN",
         "entityID": "1",
         "uniprotID": "P02185",
         "ecNumber": "",
         "cathsupfamID": "1.10.490.10"
     }
}
In general, any column from any table can be retrieved in the following way:
GET http://proline.biochem.iisc.ernet.in/PLIC/restfulget/<TABLE NAME>/<COLUMN NAME>/<COLUMN ENTRY>
For example to retreive all the binding sites for MTX ligand one could execute the following command:
GET http://proline.biochem.iisc.ernet.in/PLIC/restfulget/query_table/LIGID/MTX
The snapshots of the webserver have been shown along with the pointers to help in better interpretation of the results.
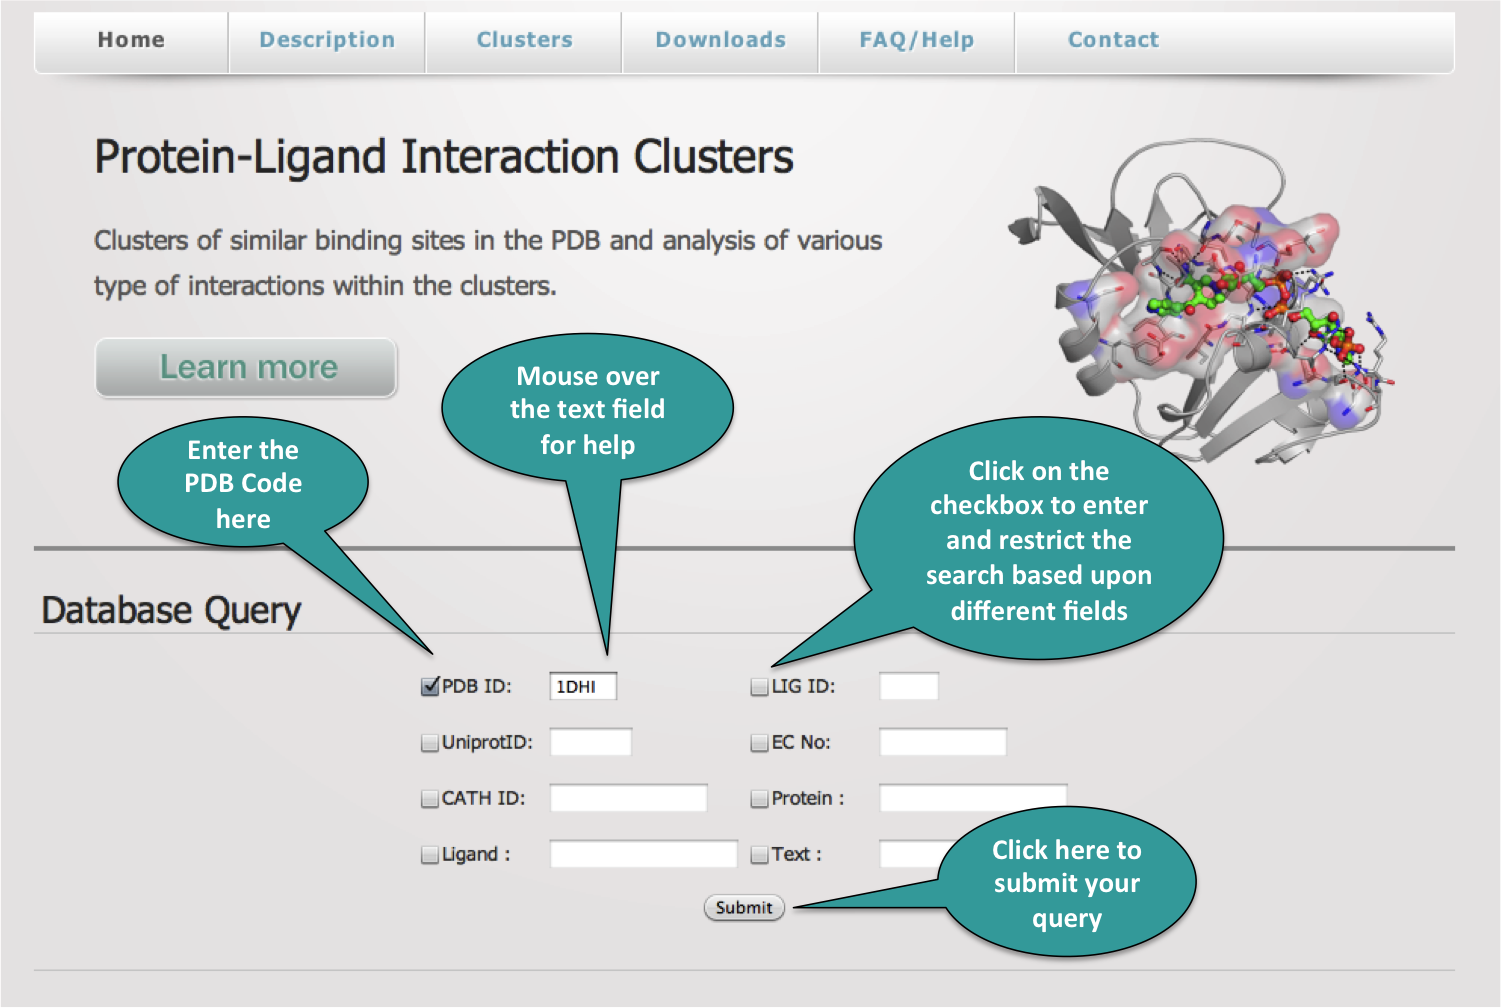
1. Query/Index Page
The database can be queried in various ways = PDB ID, HETATM ID, EC No., Uniprot ID etc. Combination of queries can also be performed by selecting the appropriate checkboxes.
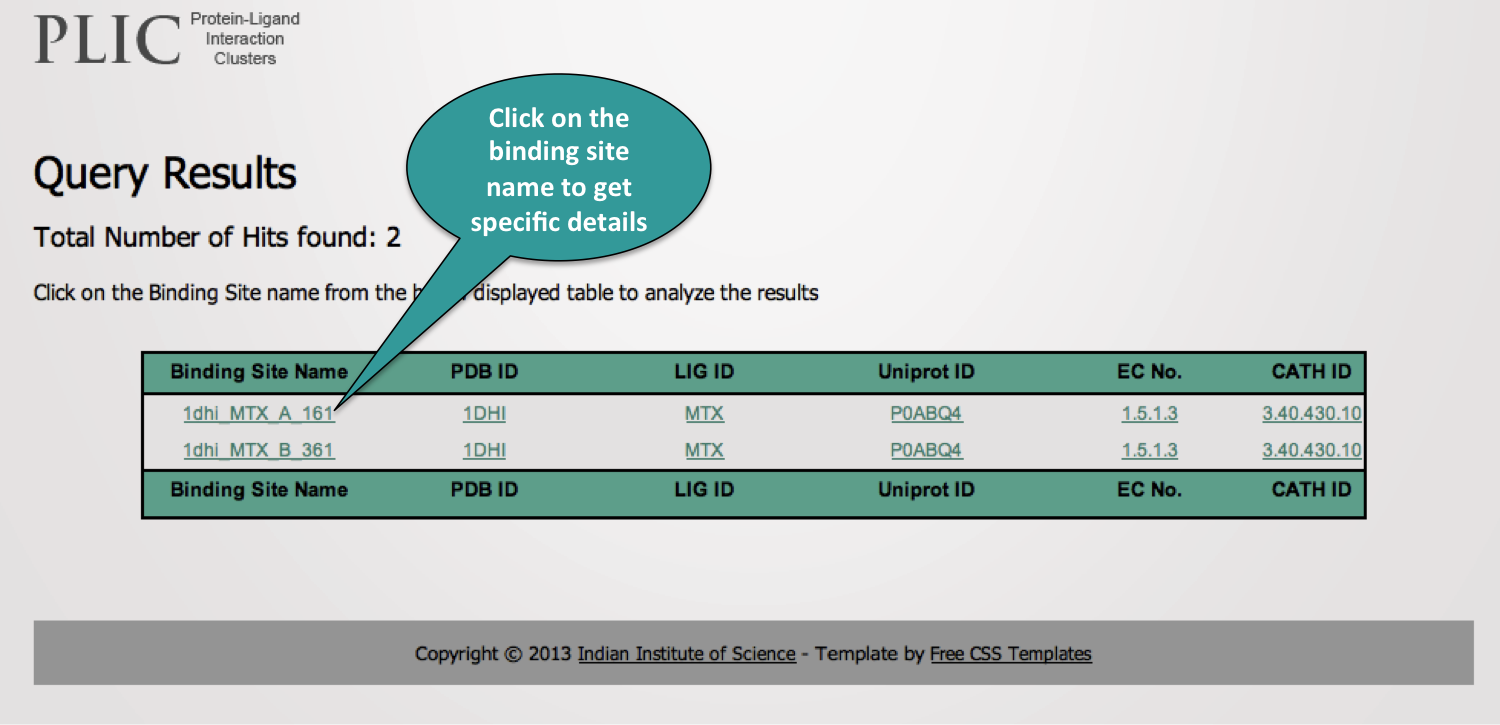
2. Query Results Page
The results of the query are displayed in the tabular form. The user can get specific information of interaction by clicking on the specific binding site name.
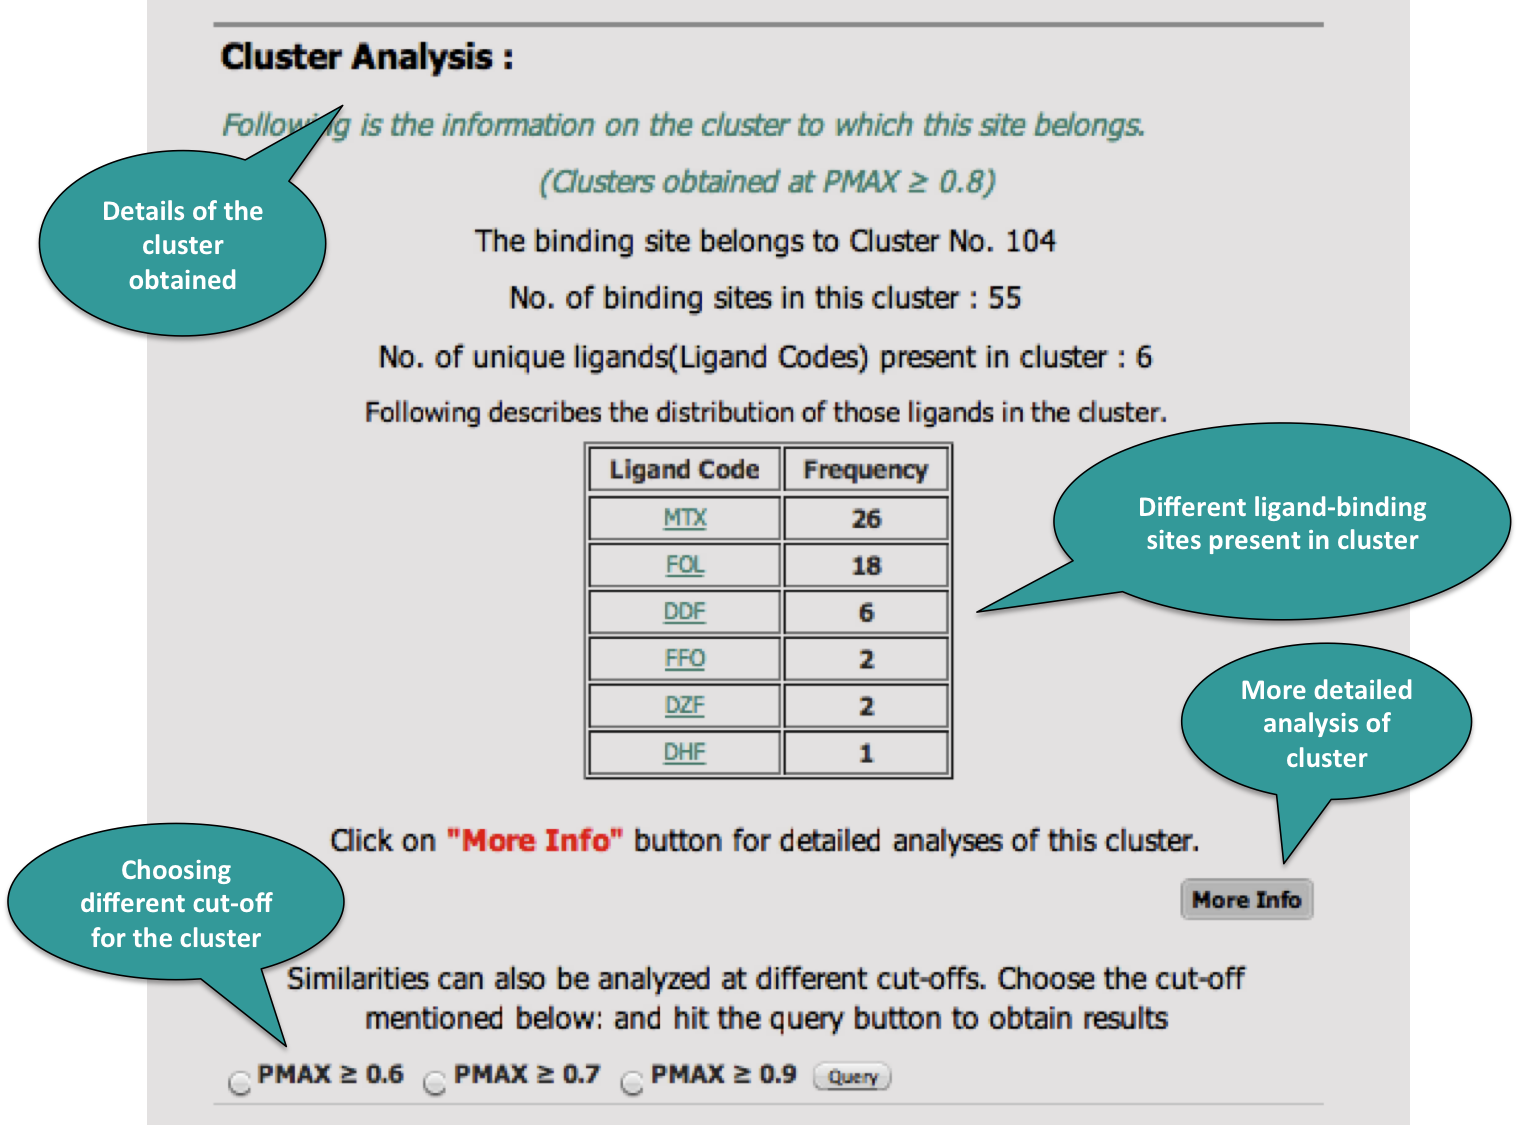
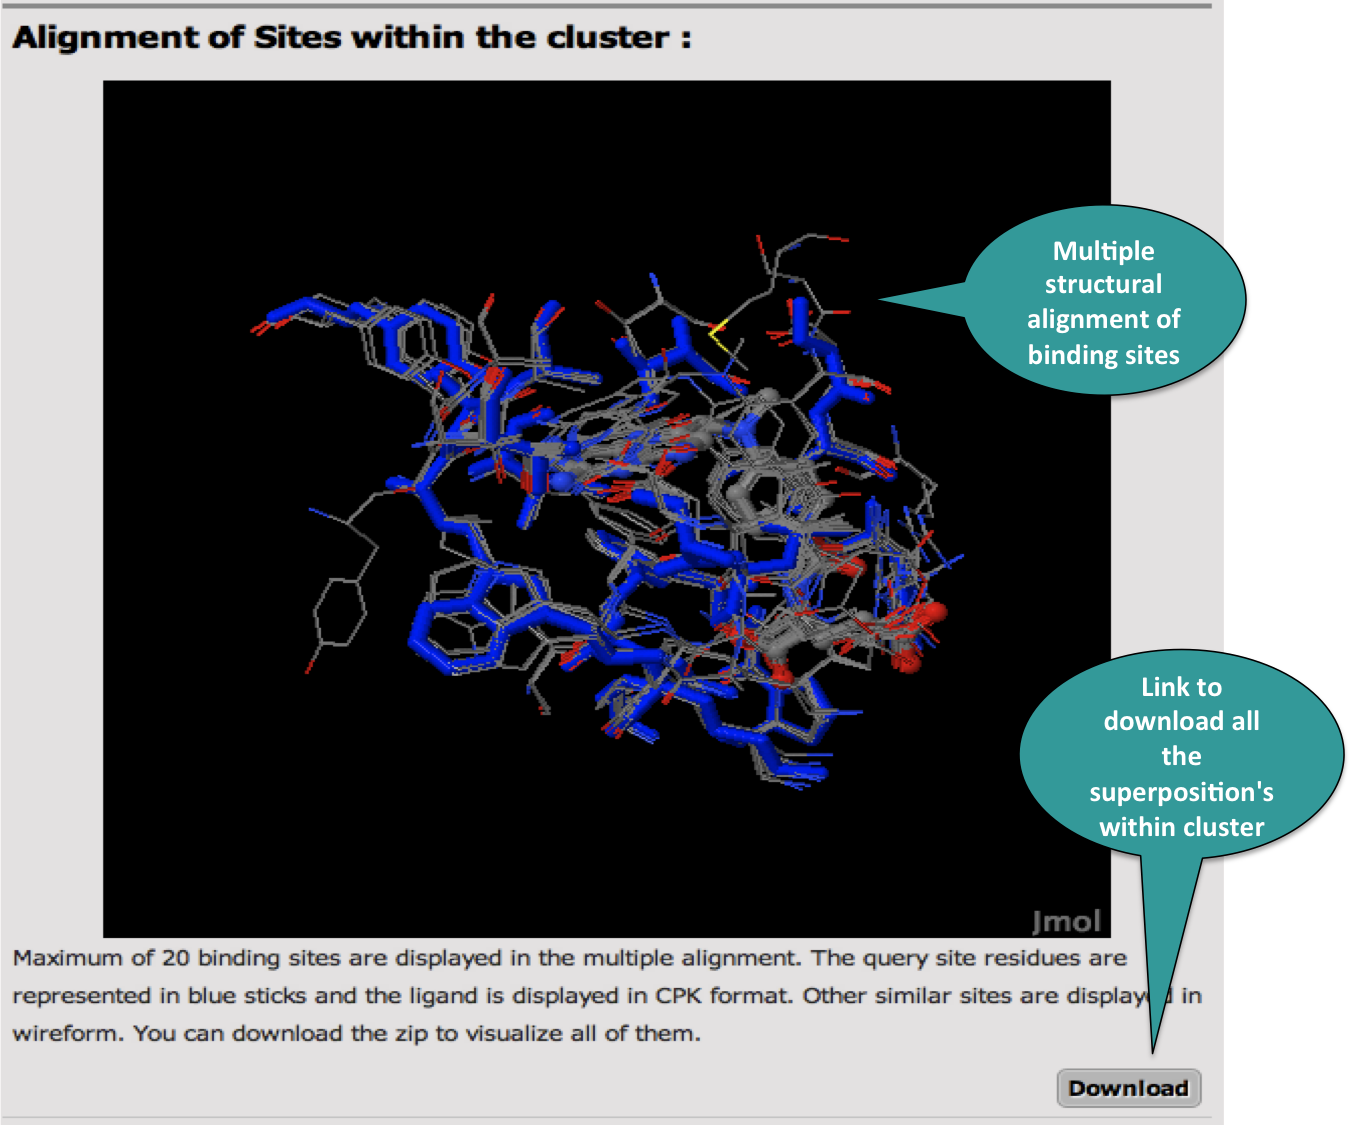
3. Results Visualization
The following snapshots describes all the information populated on the results page.
echo $table;
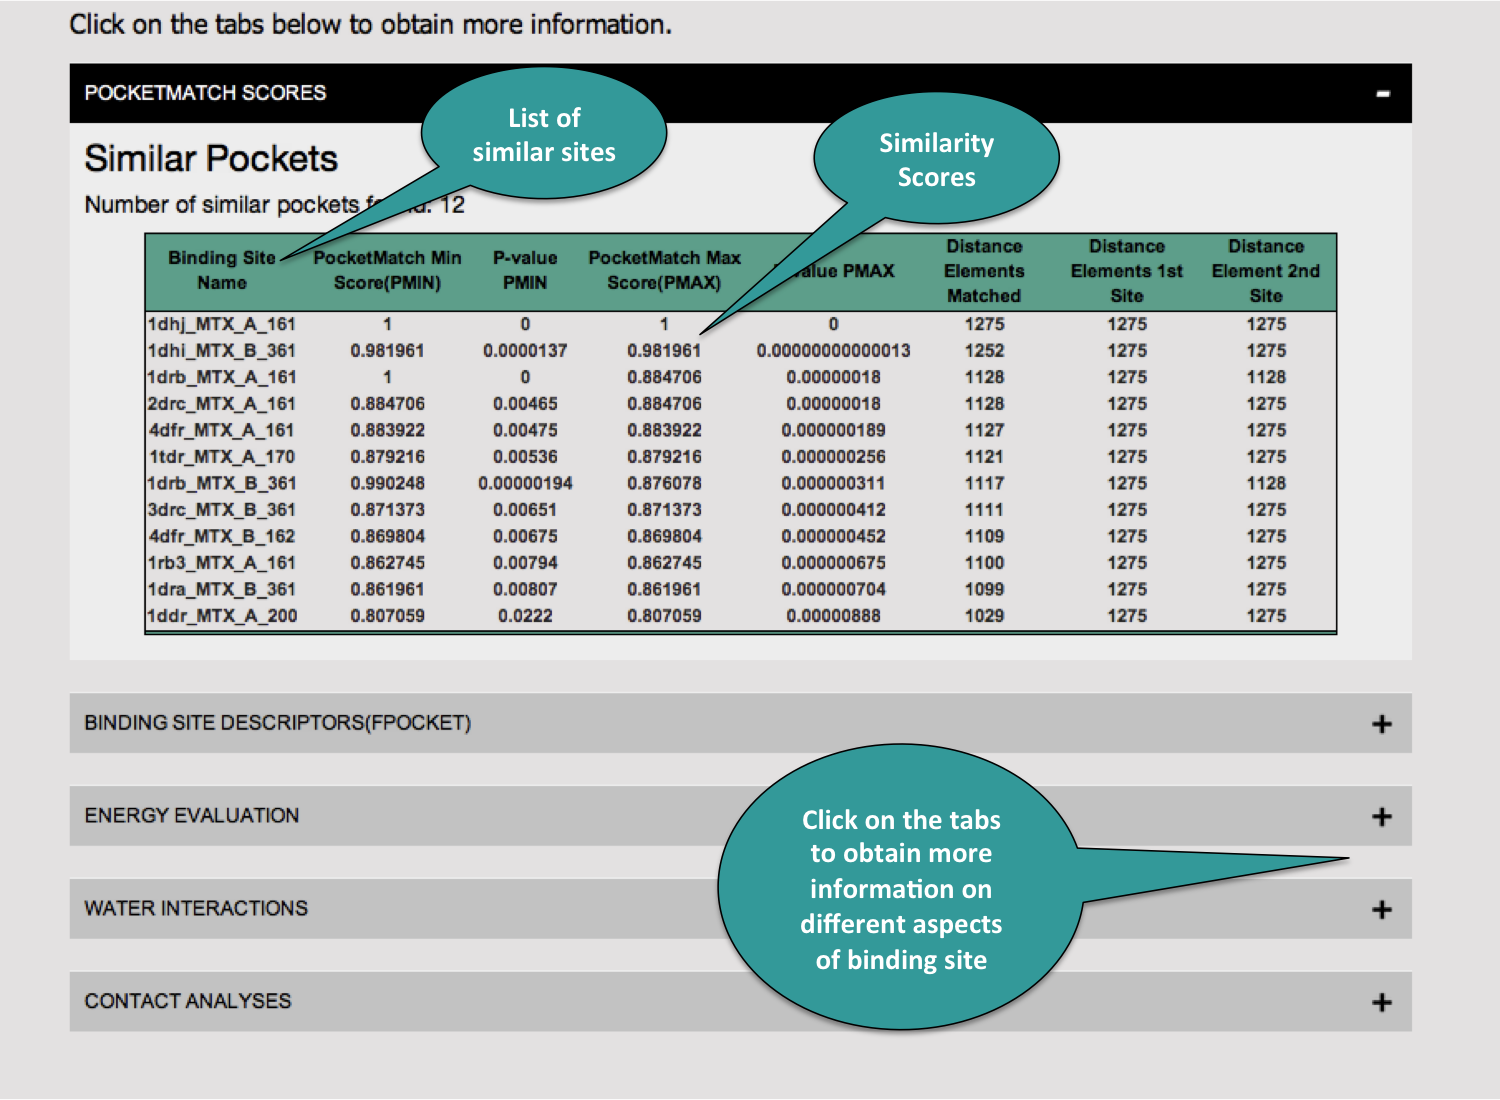
The basic information about the clusters can be obtained from here.
4. Cluster Analysis
Once the cluster analyses results page has been clicked. It displays the following window.
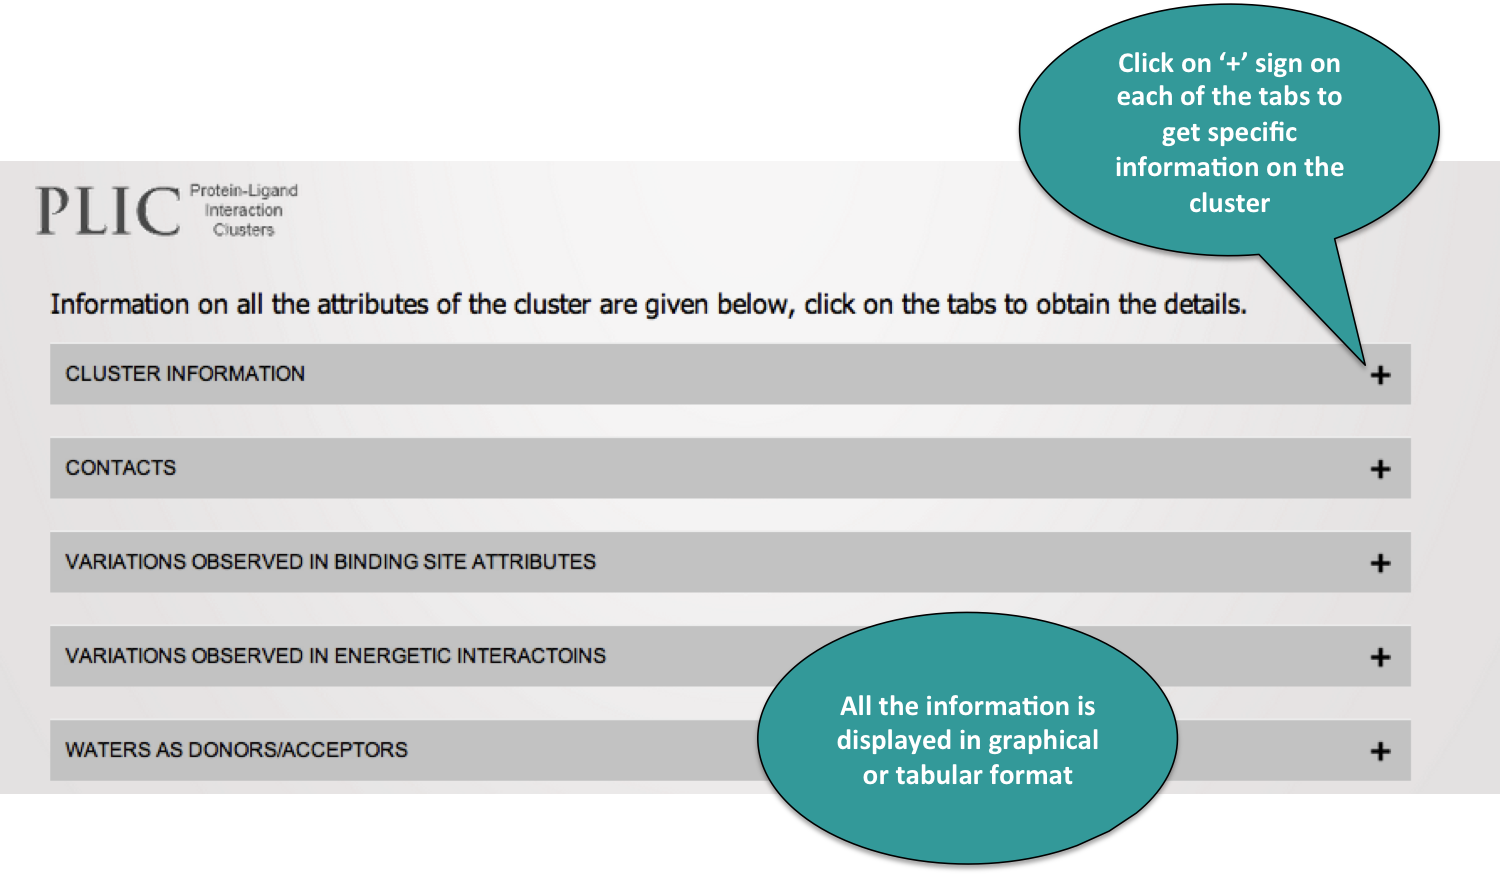
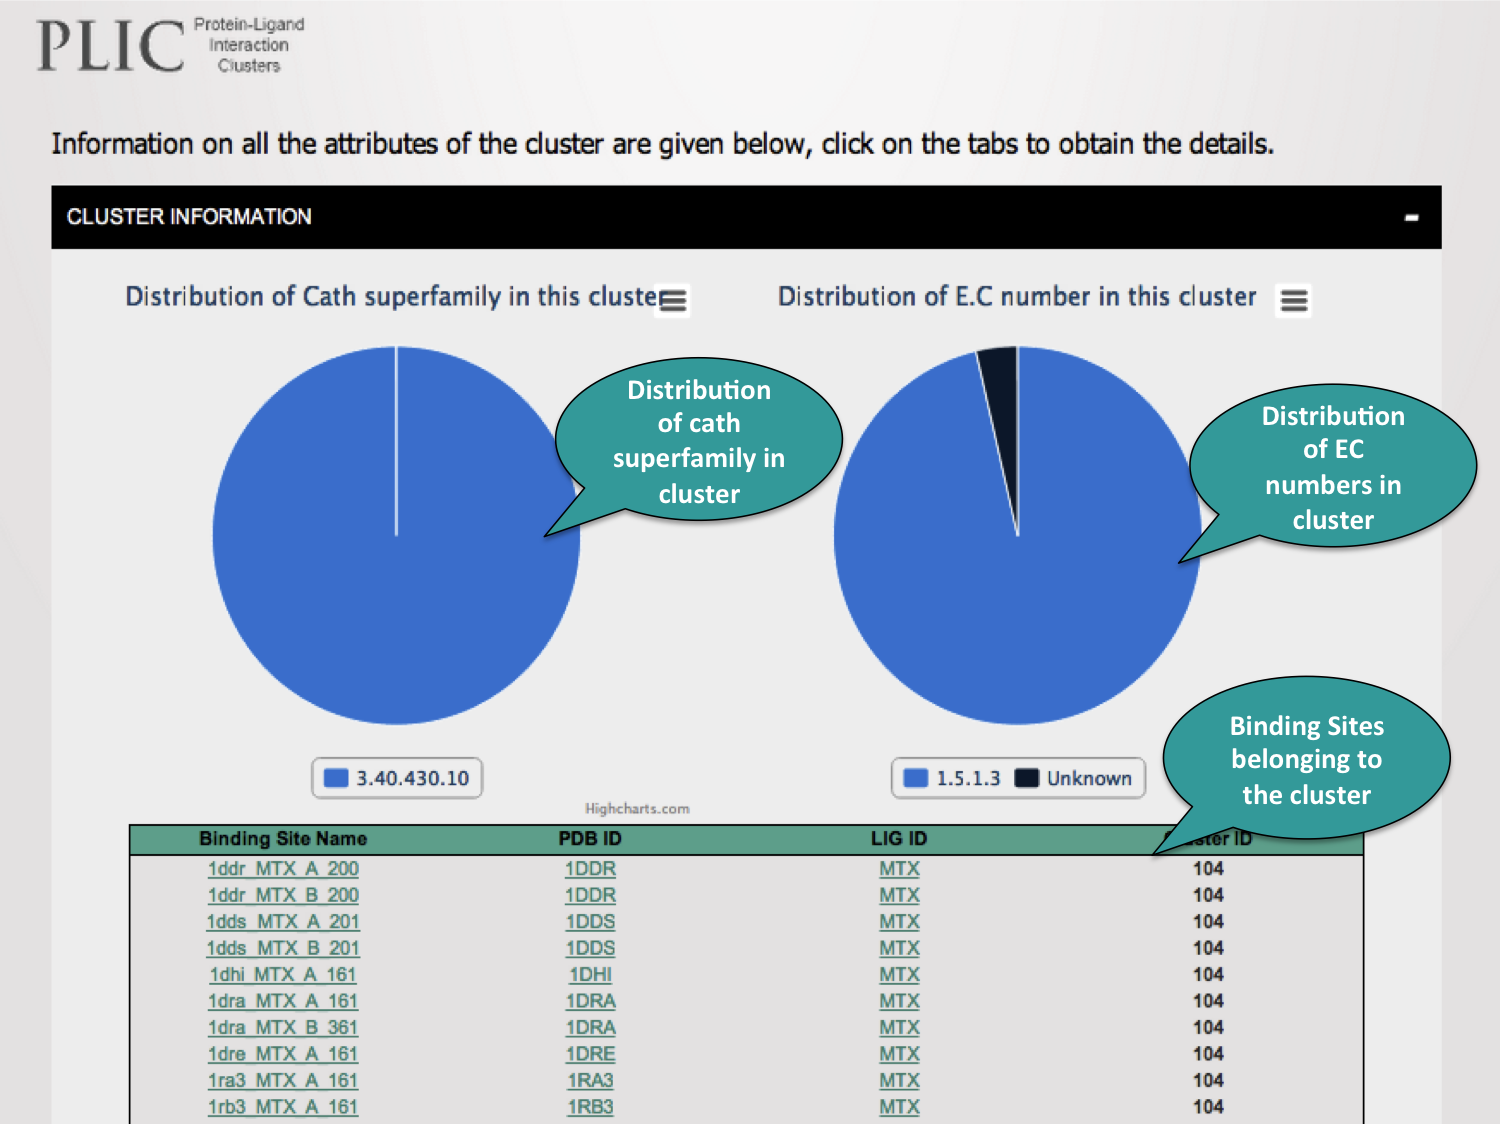
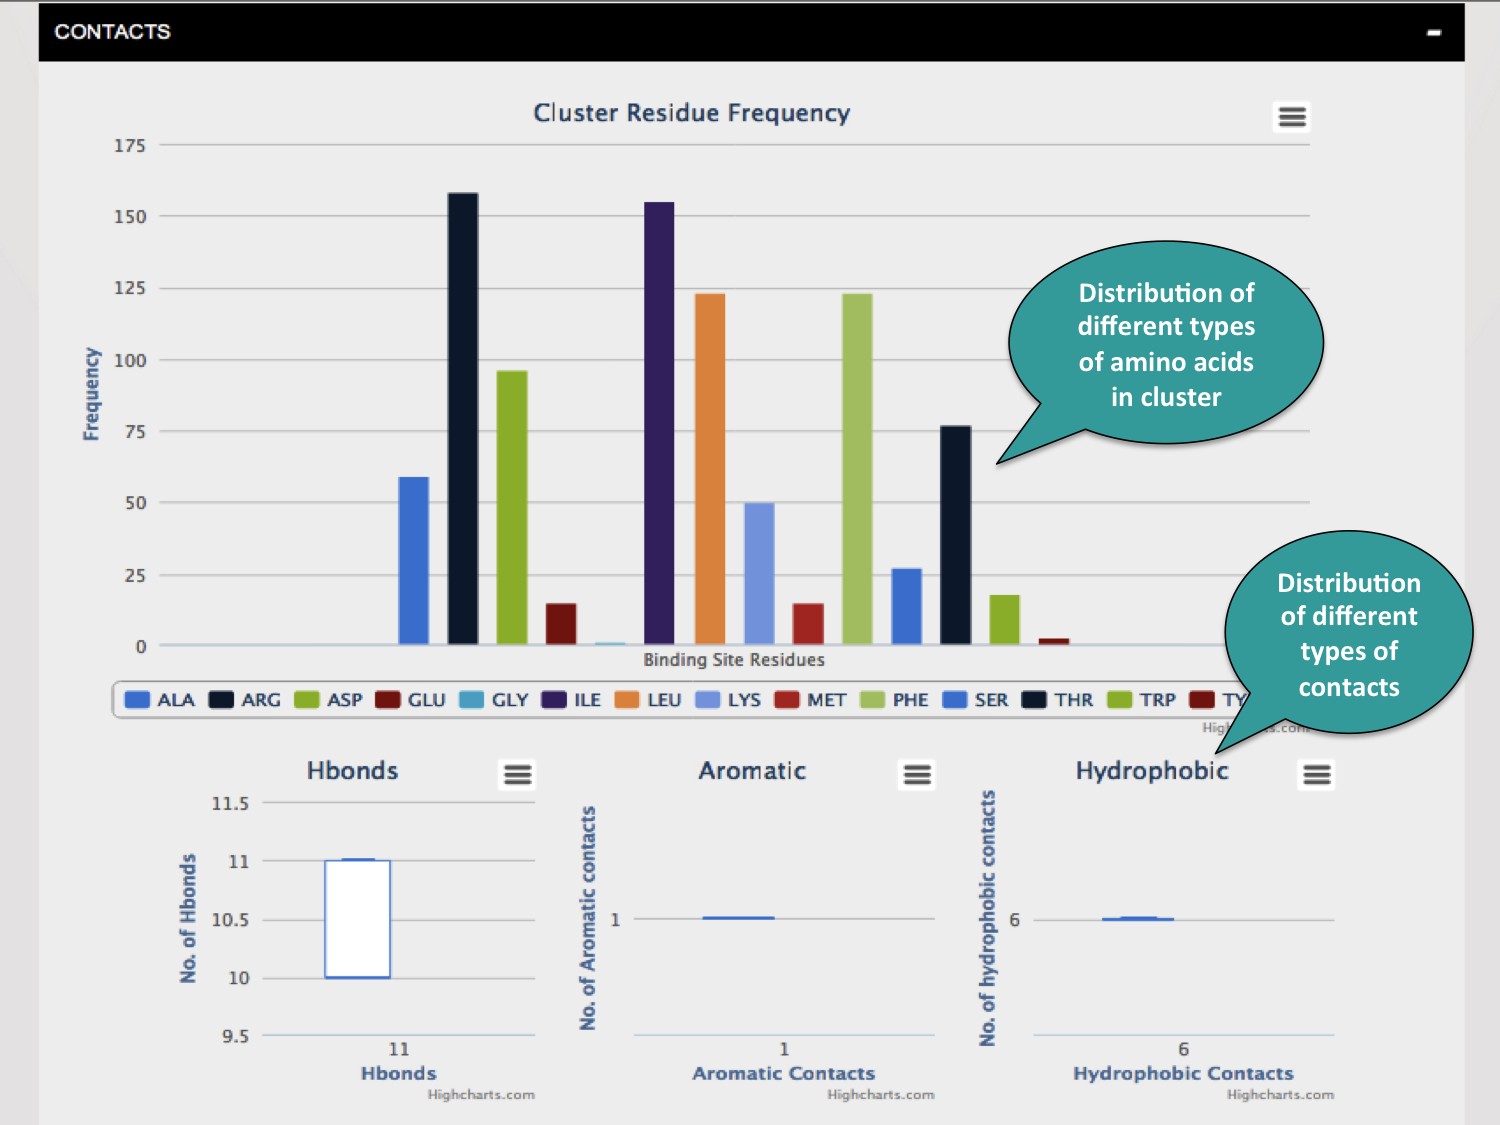
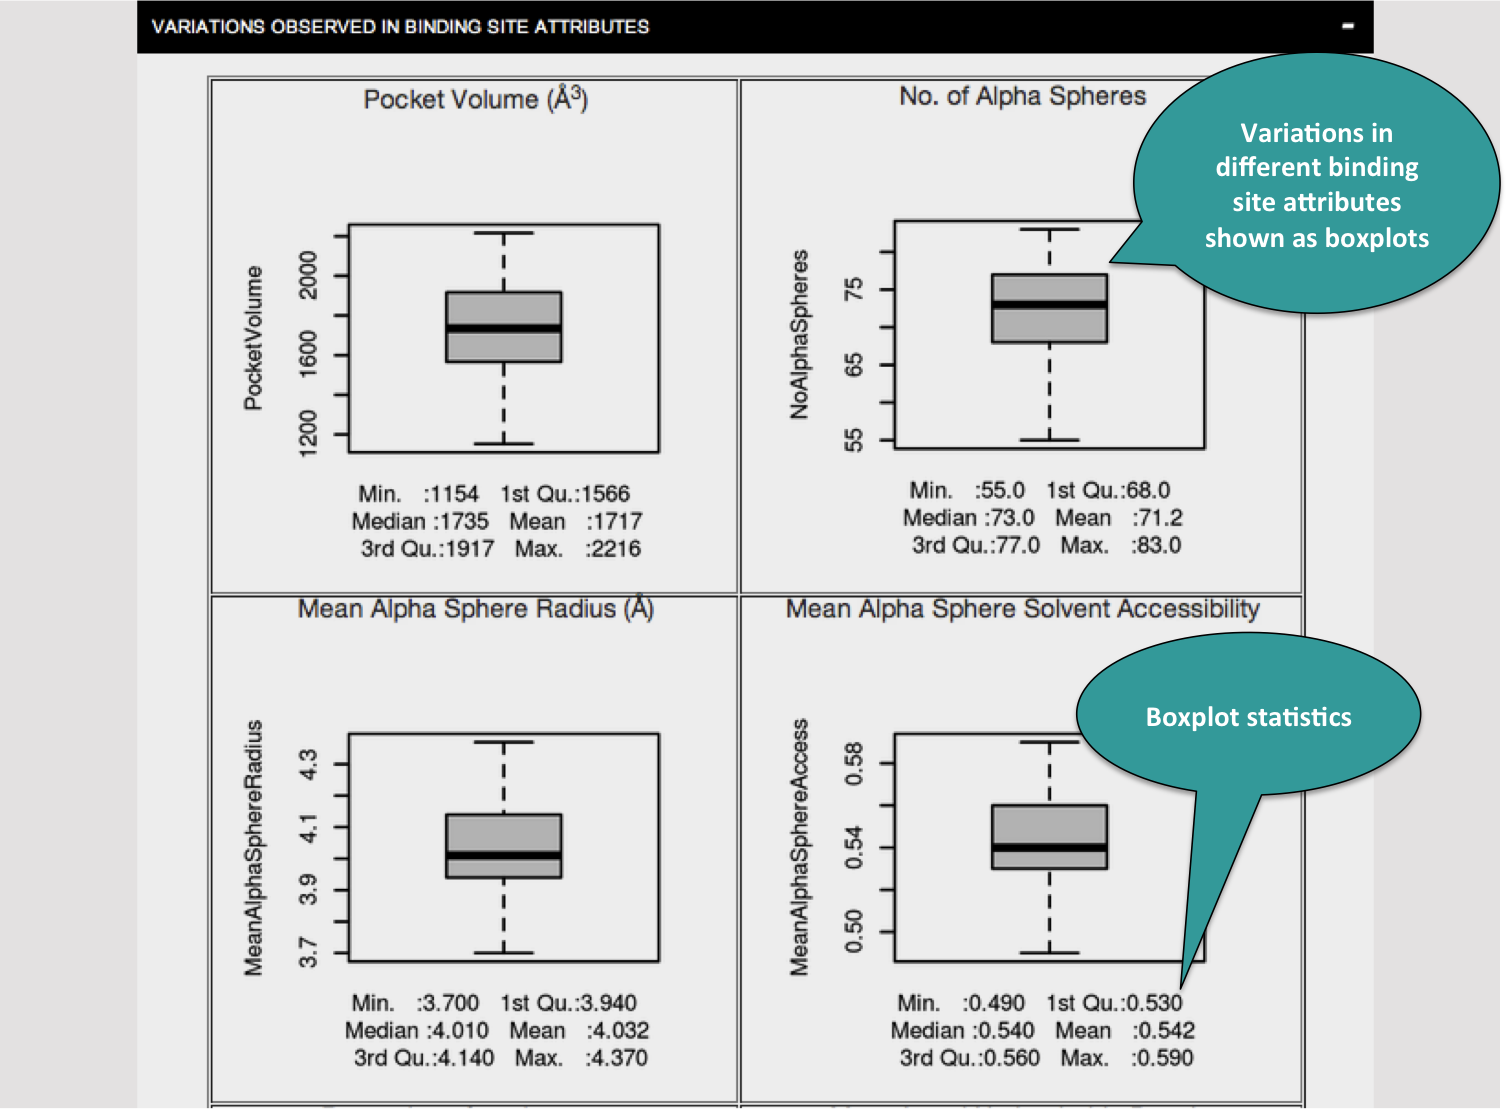
Each of the tabs can be clicked to visualize the results in the forms of graphs as shown below.
FAQ
- What is PDB Id?
- What is cath superfamily id?
- No E.C or cath superfamily assigned?
- What is PocketMatch score?
- How are clusters obtained?
- How are attributes obtained for the binding site?
- How to interpret the variation in attributes of binding site clusters?
- What is PDB Id?
- What is cath superfamily id?
- No E.C or cath superfamily assigned?
- What is PocketMatch score?
- How are clusters obtained?
- How are attributes obtained for the binding site?
- How to interpret the variation in attributes of binding site clusters?
A unique 4 character code for protein structures deposited in PDB databank. Click here for more details.
The fold of the protein can be described by a code containing hierarchial information. Click here for more details.
It is possible that the protein of interest is not an enzyme, hence it has no E.C number associated with it. Cath superfamilies might also not be associated for certain proteins. In these cases, those fields are left blank in the database. The users are requested to search by text or PDB ID alone.
For a given protein ligand interaction, similar interactions are listed out by their similarities in binding sites. An inhouse tool called PocketMatch is used to obtain the similarity score.Two scores are reported PMIN - the local similarity score, and PMAX-the global similarity scores. All the sites having score of more thank 0.80(min = 0.0 and max=1.0) are classified as similar. The P-values are reported independently for both PMIN and PMAX. Refer this for more information on algorithm.
The similarity scores obtained from the PocketMatch algorithm can be used to contruct a binding site similarity network. The MCL clustering algorithm is then used to obtain clusters from this network.
Various algorithms are used to obtain the attributes of the binding sites. For shape descriptors - fPocket is used. AutoDock and EasyMIFS are used for the calulation of various energetic parameters.
The variations in the different attributes are presented in the form of boxplot.Refer to this link about how to interpret the box plots.